China drive the rest of ASIA’s exports
Export growth from emerging Asia (excludes China) by destination, shows that the black line: export growth to the Eurozone, despite its recent bounce, is still down sharply from 2017, given the region’s slowdown.
On the other hand, export growth to China has rebounded sharply. Shipments to the Mainland have contributed twice as much to export growth in the region so far this year as those to the US (Eurozone: flat)
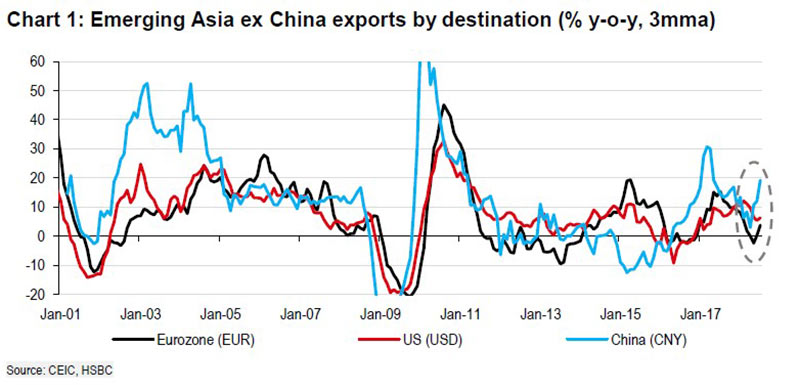
Chart 2 shows increase of shipments from Korea to China (partly a price effect on semiconductors and petrochemicals, still…). For Japan, exports to China are roughly growing at a 10% annual but are flat to the US (Chart 3). Broadly, the same is true for ASEAN.
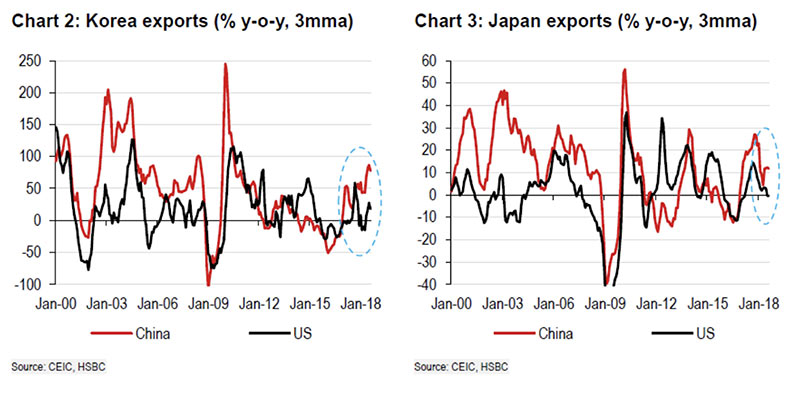
Chart 4. The red line shows import growth of manufactured goods into China (from the entire world, not just Asia), thus mostly cutting out the effect of commodity price swings. These are up solidly. For now, it’s mostly China’s order that’s driving trade growth in the rest of Asia.
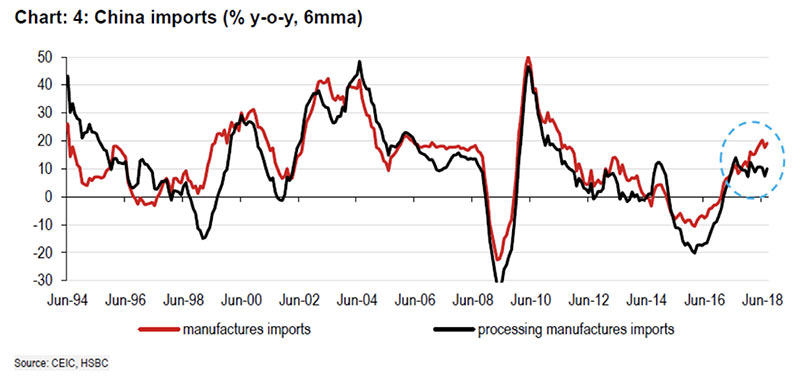
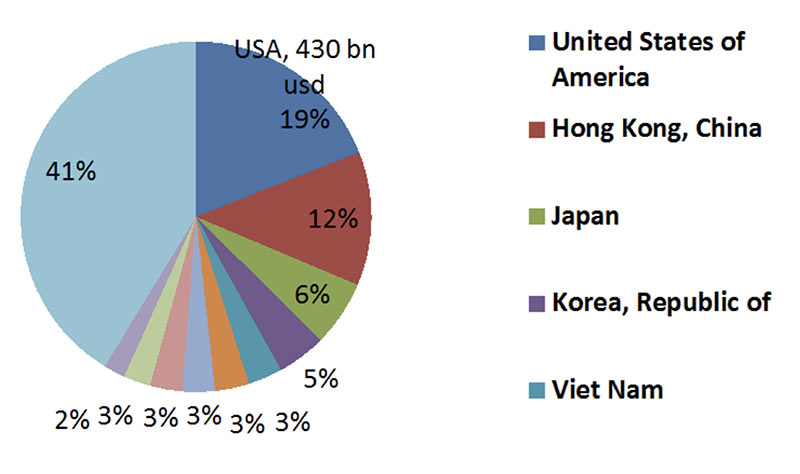
Chart 5 gets back to China exports by destination; we found that US contributed around ¼ of total China’s world exports. US-China tariff rate increase would have indirect impact on other Asia more or less. I think some exports may have to be re-routed to other countries before forwarding to the U.S.
Chart 5 China’s world exports by destination (as of 2017, total China exports was 2.26 trillion usd)